Data Ontology is the Future with Estie Boshoff
Executive Summary
This webinar introduces data ontology, including notes on domains and taxonomies and an overview of ontologies and their applications in data analysis. It covers the challenges and advantages of ontology modelling and discusses the tools and skills required for data modelling and ontology. The importance of ontologies in data governance and knowledge discovery, along with the differences between property graphs and knowledge graphs, is also highlighted. Additionally, the use of Neo4j for data import and diagram building, transaction analysis, and risk assessment is discussed, along with the importance of data and knowledge graphs in data analysis.
Webinar Details
Title: Data Ontology is the Future with Estie Boshoff
Date: 05 April 2022
Presenter: Estie Boshoff
Meetup Group: INs & OUTs of Data Modelling
Write-up Author: Howard Diesel
Contents
Introduction to Data Ontology
Notes on Domains and Taxonomies
Integrating Different Domains and Elements for Data Modelling
An Introduction to Ontologies and Their Applications in Data Analysis
Challenges in Change Management and Defining Domains within Data Topologies
Tools and Skills for Data Modelling and Ontology
Skills and Knowledge Required for a Professional Writer
The Importance of Ontologies in Data Governance and Knowledge Discovery
Understanding Data Classification and Taxonomies
Challenges and Advantages of Ontology Modelling
Using Gra.fo to Import and Map Ontologies in Neo4j
Importing Ontology into Gra.fo
Using Neo4j for data import and diagram building
Analysis of Neo4j as a Property Graph and its Progress towards a Knowledge Graph
Differences between a Property Graph and a Knowledge Graph
The Differences Between Property Graphs and Knowledge Graphs
Discussion on the use of Neo4j and knowledge graphs
Importing Ontologies into Neo4j Using Neo Semantics Plugin
Understanding the Importance of Data and Knowledge Graphs
Graphs and their Applications in Data Analysis
Transaction Analysis and Risk Assessment
Introduction to Data Ontology
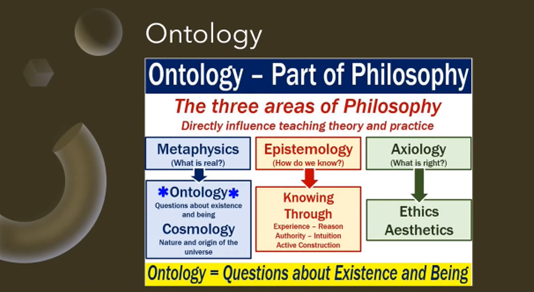
Estie Boshoff provides a brief yet comprehensive overview of data ontology and its relevance in computer and information science. Her overview covers the basics of ontology as a formal representation of categories, properties, and relationships in data and explains the importance of data modellers being familiar with ontology concepts. Estie also introduces new ontology terms, including domains of discourse, multiple levels, subject area domains, conceptual model domains, and attribute domains, and discusses the philosophical origins of ontology in metaphysics, epistemology, and axiology. Additionally, she highlights ontology's role in answering questions about existence and being in relation to data and how it is a philosophical approach to data management.
Figure 1 Ontology Definition
Figure 2 Ontology - Part of Philosophy
Notes on Domains and Taxonomies
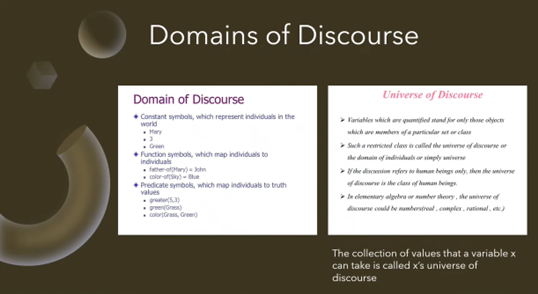
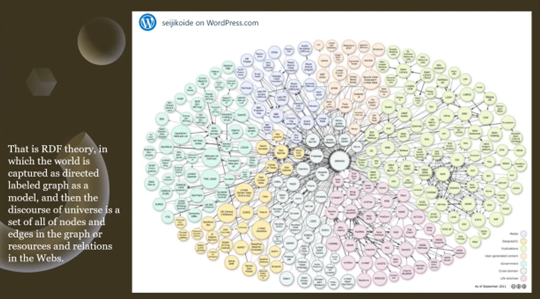
Domains of discourse are discussed, which involve symbols representing individuals, relationships, and truth values. The focus is on the South African example of different domains, such as official, social, and teaching domains in higher education. The main challenge is to connect and integrate these entities and external taxonomies sustainably. Visual representations, like Lego blocks, can be useful in building and understanding these concepts. The ontology model and labelled graphs also depict the large-scale interrelations between concepts in various subject areas such as media, geography, publications, and governments.
Figure 3 Domains of Discourse
Figure 4 Domains of Discourse (DoD) Example
Figure 5 RDF Theory
Integrating Different Domains and Elements for Data Modelling
The importance of combining different domains and elements for data modelling is highlighted. It is suggested to start from the bottom by analysing data and understanding its structure to guide the data modelling process. Comparing the perceived world with actual data can provide valuable insights. Multiple taxonomies in sustainability exist, and the need to analyse balance sheets with different domain perspectives is discussed. Listening to the data by ingesting balance sheets and mapping them to different domains can be beneficial. The process of mapping data to new domains or mapping ontologies to other domains is deliberated. Algorithms or diagrams can be used to compare and match data elements. Integrating XBRL data representation of balance sheets with ontologies can provide useful insights. Finally, the options of linking data to the ontology or linking ontologies together to analyse the data are considered.
An Introduction to Ontologies and Their Applications in Data Analysis
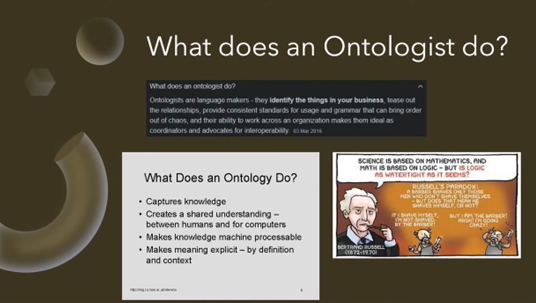
Estie discusses the possibility of working with ontologies in two ways: by analysing the data first and allowing it to reveal insights or by connecting ontologies and then analysing the data for insights. It highlights the merits of both approaches for data analysis and the potential for their combination. The current plan of using different taxonomies, importing taxonomy data, adding ontologies, and conducting analysis is also discussed. Additionally, there is a suggestion of a fascinating alternative approach of starting from the bottom up. A question is posed about the direct link between this type of data model and a graph database, which Estie says she will answer later. The role of an Ontologist is explained as a language maker who identifies things, gathers relationships, provides standard usage grammar, and brings order and interoperability to the organisation. Finally, the technical aspects involved in the work of ontologies are covered.
Figure 6 What does an Ontologist do?
Challenges in Change Management and Defining Domains within Data Topologies
The webinar covers several important topics related to change management, logic, and data management. It discusses the importance of creating a shared understanding and implementing effective change management practices. Additionally, it explores the concept of messy and mutually exclusive items that can be collectively exhausted. Estie highlights the link between science, mathematics, and logic, focusing on Russell's Paradox, which questions the logical certainty of math. The paradox of a barber who only shaves those who don't shave themselves is also examined.
Philosophical considerations for ontologists and the challenges of managing data sets and defining domains within data topologies are also discussed. The summary highlights the difficulty of dealing with loops and deciding what is included or excluded from a set. Further, it touches on the dependency on industry data models for mapping domains and the constant changes and updates in defining domain criteria. Lastly, it touches on the cyclical issues and challenges faced in aligning perspectives within a team.
Tools and Skills for Data Modelling and Ontology
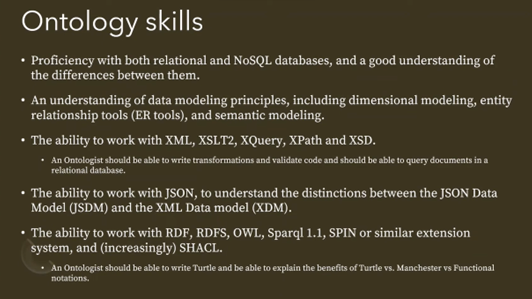
The ontology field involves studying the nature of existence and categorising entities. Ontologists use various tools for data modelling, including relational and SQL databases. They also work with semantic chains or lexicons to classify and sort information. Lexicographers compile results into dictionaries, while taxonomy specialists classify and sort information based on established systems. Ontologists are considered language engineers who construct new languages and data privacy ontologies. To be proficient in this field, ontologists need to have knowledge of relational and SQL databases, data modelling principles, entity relationship tools, semantic modelling, XML, XSLT, and XQuery.
Figure 7 What does an Ontologist do, continued
Skills and Knowledge Required for a Professional Writer
Estie highlights the key skills and knowledge required for a professional working with data systems. This includes expertise in writing and using validators for XPath, XSD, and JSON and familiarity with relational databases and their document creation. Understanding the differences between JSON and XML data models and being proficient in working with RDF, RDFS, OWL, Spark, and SPARQL is important. Awareness of new extensions like SHACL is also important in various applications.
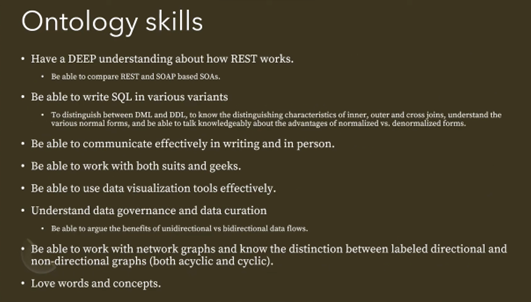
A deep comprehension of REST and SOAP-based service-oriented architectures, SQL proficiency, and knowledge of normalised and denormalised forms are vital. Effective communication skills, the ability to work with different types of team members, and knowledge of data visualisation tools, data governance, and data curation are also essential.
Moreover, proficiency in working with network graphs, understanding their directions and labels, and creating a data ontology by researching existing ontologies and formats is required. These skills and knowledge are critical for a successful career in data systems.
Figure 8 Ontology skills
Figure 9 Ontology skills continued
The Importance of Ontologies in Data Governance and Knowledge Discovery
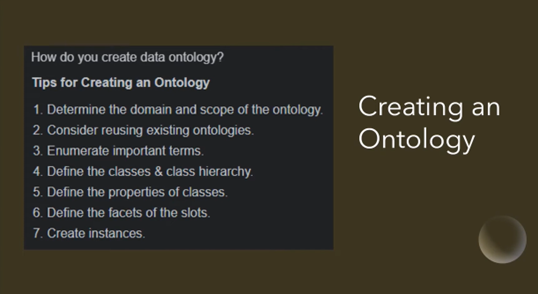
The importance of ontologies in developing data governance models is highlighted. Existing ontologies serve as a guide for identifying important terms and classes in class hierarchies. Defining properties of classes and facets of slots is crucial in ontology development, and developing different instances helps establish a robust data governance model.
Data ontology can aid in building a canonical model for the company's data, focusing on content and how it is viewed. It also allows for identifying interesting connections and establishing data governance models. However, developing a data ontology requires patience and understanding that progress takes time.
The future of data ontology involves browsing through concepts, tracing causative agents, and linking items for knowledge discovery. This offers a different approach to viewing and accessing data, providing new ways in health sciences and knowledge-based industries. Nonetheless, the question of data abstraction and generalisation arises, highlighting potential challenges in mapping and generalising different data classes.
Figure 10 Creating an Ontology
Figure 11 Data Ontology is the FUTURE!
Understanding Data Classification and Taxonomies
Estie discusses the importance of narrowing the scope and creating a taxonomy to classify industries and sustainability standards. She highlights the ability of data to have multiple connections to metadata and be tagged or connected to various domains. The concept of a data item being linked to multiple classifications is also explained, using the example of a plate number being linked to a car model and car type. Estie further elaborates on the excitement and challenge of translating data from one domain to another while considering the defined universes of each domain. The role of upper-level ontologies, like Basic Formal Ontology (BFO), in classifying concepts rather than just data is elaborated on. Finally, the possibility of reverse engineering data models from the data itself rather than imposing predefined definitions is discussed.
Challenges and Advantages of Ontology Modelling
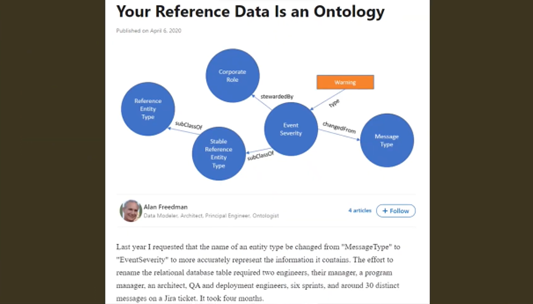
The discovery mode is useful for ensuring data accuracy and model completeness. By iteratively discovering unknowns through new data and enhancing the model, users have two options for improving accuracy: enhancing the model with categorisation or fixing incorrect data. It's important to note that different classifications in the ontology can significantly affect how analytics are conducted downstream, and some classifications are not additive, which can lead to double accounting. Therefore, it's crucial to ensure accuracy in visuals and help new users understand the ontology. Additionally, changing an entity name in a relational database table can be time-consuming and require multiple resources. Ontology modelling aims to reduce this time and effort by providing flexibility, which needs to be tested through practical applications.
Figure 12 Your reference data is an Ontology
Using Gra.fo to Import and Map Ontologies in Neo4j
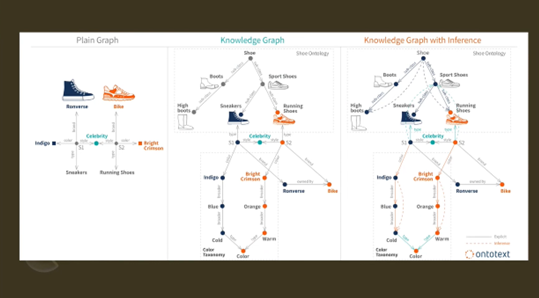
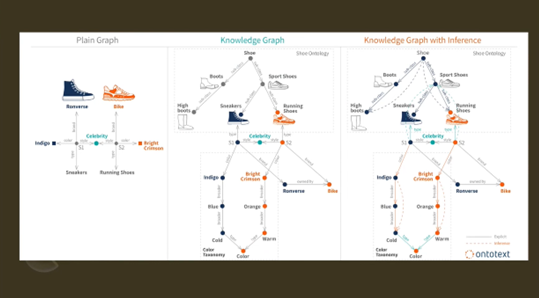
Creating knowledge graphs or labelled graphs involves adding data to the ontology structure. Ontologies are structured to illustrate how they relate to one another. Inferences can be drawn from ontologies, such as the relationship between different types of shoes.
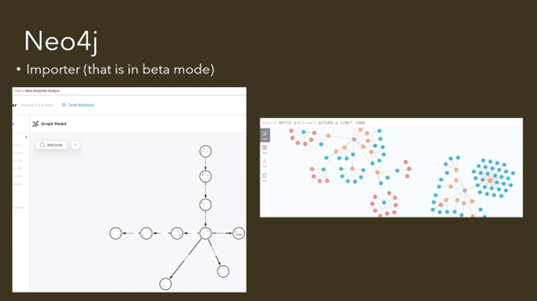
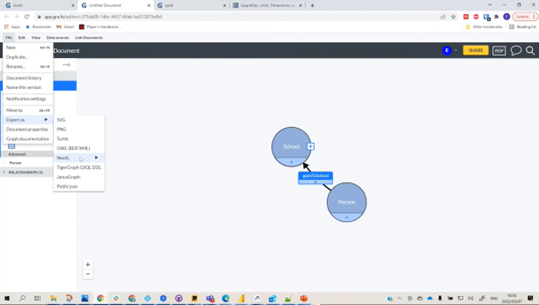
To facilitate this process, Gra.fo is an intuitive tool that can be used for importing or mapping ontologies. It allows for the import of existing ontologies in various formats, including turtle, JSON, and zip files. Additionally, Neo4j has an importer feature that can be used to build a resulting knowledge graph or property graph.
Using ontologies and knowledge graphs can provide valuable insights into complex data relationships and help researchers identify patterns and connections that may not be immediately apparent.
Figure 13 Using ontologies and knowledge graphs can provide valuable insights
Figure 14 Gra.fo. import or export
Figure 15 Neo4j. importer (in beta mode)
Importing Ontology into Gra.fo
Gra.fo allows users to import ontology files in formats such as rdf or owl by clicking the "import" button. However, when importing a large ontology file, there may be a limitation on the number of entities that can be imported (likely around a thousand entities).
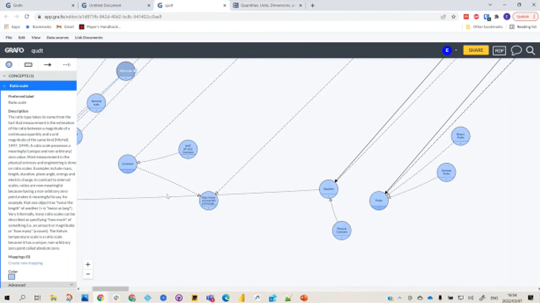
Once imported, users can visualise the ontology in Gra.fo. The visualisation may contain long items, but clicking on them provides more detail on the left side of the screen. Gra.fo allows users to navigate through ontology items, add relationships, and create new concepts.
Finally, completed ontologies can be exported in various formats like turtle or owl for use in other platforms like neo4j. However, slight mapping issues may exist when importing ontology files into neo4j.
Figure 16 Importing Ontology into Gra.fo
Figure 17 Importing Ontology into Gra.fo continued
Using Neo4j for data import and diagram building
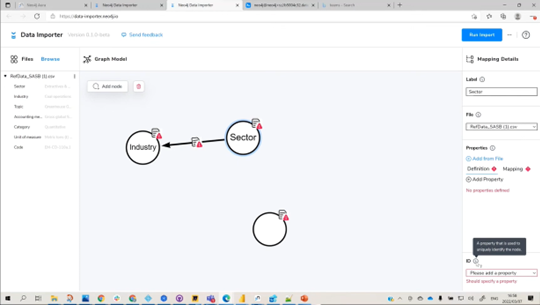
The Neo4j data importer, Link Data Mode, is a helpful tool for browsing and selecting CSV files to be imported. It allows you to create nodes and link them to other nodes while resolving any issues that arise during the process. You can import multiple files and specify the source of the data. The process involves mapping the unique identifier in each item and defining the relationships between nodes. By confirming and resolving any issues, you can easily build a diagram in Neo4j. Once you have configured the import, Neo4j generates the import for you. To use Neo4j, you must have Neo4j and Neosomatics installed as libraries.
Figure 18 Using Neo4j for data import and diagram building
Figure 19 Using Neo4j for data import and diagram building continued
Figure 20 Using Neo4j for data import and diagram building continued
Analysis of Neo4j as a Property Graph and its Progress towards a Knowledge Graph
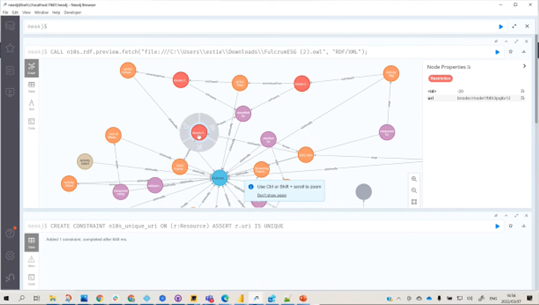
Estie discusses data import and analysis using Neo4j. She focuses on economic impact investing and ESG investment integration. Estie explains how different colours in the graph represent different areas and headings, making it easy to visualise and explore the data. She also covered the importing of data for SAS B1. The information displayed includes sector, industry, topic, counting metric, category, units of measure, and code. However, some data points were not linked to anything, indicating potential gaps in knowledge and areas that need further discussion. Neo4j is currently a property graph, but efforts are being made to make it RDF-compatible and expand it into a knowledge graph. Neo4j's progress in becoming a knowledge graph involves the ability to import and export RDF data using a specific Near Semantics library. Interestingly, Estie expresses surprise at learning that Neo4j was originally a traditional knowledge graph.
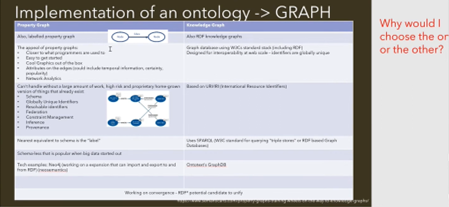
Figure 22 Implementation of an Ontology
Figure 23 Another look at the graph comparison
Differences between a Property Graph and a Knowledge Graph
The difference between a property graph and a knowledge graph is explained. A property graph is a graph where nodes are connected to other nodes via edges. On the other hand, a knowledge graph involves adding semantic data or metadata to connect a node to a hierarchy or taxonomy. The speaker was initially confused about whether Neo4j, a graph database, can support adding semantic ontology or taxonomy to its data. However, it was later learned that Neo4j could include semantic functionality, making it a knowledge graph rather than just a property graph.
The Differences Between Property Graphs and Knowledge Graphs
Using schemas in knowledge graphs is limited to intra-interoperability at the web scale. At the same time, unique items are present in property graphs, which can cause uncertainty when integrating them with other items. To address this, Gra.fo allows the design of knowledge graphs independently using international resource identifiers (URI). These can be registered and associated with data elements separately to create two distinct graphs with RDF or OWL. Neo4j lacks support for SPARQL, leading to the development of the RDF* extension. Although Neo4j created Cypher, intending to become the standard, it didn't gain enough support. The development of SPARQL involved the W3C and possibly Apache. Knowledge graphs connect RDF elements with different nodes, illustrating the distinction from property graphs. As for whether the listener can perceive the differences between property graphs and knowledge graphs, it remains an open question.
Discussion on the use of Neo4j and knowledge graphs
Paul wonders if designing an ontology in a separate tool and relating the nodes together in Neo4j is possible. He clarifies that he has not imported a knowledge graph or linked nodes to existing knowledge growth in Neo4j. Howard highlights the introduction of Neo-semantics, which allows for stepping up from property graphs to knowledge graphs, and the support of SPARQL for inference in Neo4j.
Importing Ontologies into Neo4j Using Neo Semantics Plugin
Howard summarises the differences between property graph diagrams and ontologies and their relationship with Neo4j. Property graph diagrams are basic and simplistic, whereas ontologies define the relationships between data in the property graph and add extra capabilities. Ontologies represent domain semantics and are associated with the property graph nodes. Manual data modelling involves adding knowledge to nodes by analysing their properties, although starting with data and adding typings manually is a possible approach to data modelling. Neo4j enables importing ontologies using the Neo-semantics plugin/library, which allows importing RDF files such as taxonomies in RDA format, simplifying the process of importing ontologies.
Understanding the Importance of Data and Knowledge Graphs
Howard discusses potential issues with data and knowledge graphs, highlighting the challenges of determining the domains and connecting them. The inability to map nodes leads to confusion, and the presence of orphans indicates irregular connections. The sparsity of connections is another factor to consider. Howard references knowledge graphs in analysing complex balance sheets in the central bank, allowing for focused filtering and retrieving specific elements.
Graphs and their Applications in Data Analysis
Graphs are a powerful tool for connecting and analysing data points. They enable us to flexibly tackle classification and association issues, making them particularly useful for data analysis. Knowledge graphs are commonly used in customer 360 and master data management to provide a comprehensive view of customer data and ensure data quality. Additionally, graph analysis can help identify complex relationships between transactions and customers, revealing patterns and suspicious behaviour that may not be apparent through traditional data analysis techniques. Overall, graphs have the potential to unveil valuable insights and relationships hidden within data.
Transaction Analysis and Risk Assessment
Howard includes two experiences related to financial analysis, focusing on transaction analysis and balance sheet data. KYC is also highlighted as a standard procedure for banks in money transfers. Suspicion was raised by a series of transactions with the same amounts within 10 minutes. Further investigation revealed notable anomalies, such as individuals with low funds participating in large transactions and ones with significant wealth. The investigation required iterative information gathering and filtering to uncover irregularities. The benefits of a separate knowledge domain were recognised in facilitating analysis and linking different aspects of the investigation.
If you would like to join the discussion, please visit our community platform, the Data Professional Expedition.
Additionally, if you would like to be a guest speaker on a future webinar, kindly contact Debbie (social@modelwaresystems.com)
Don’t forget to join our exciting LinkedIn and Meetup data communities not to miss out!


