How to Prepare for the CDMP Data Quality Specialist Exam
Executive Summary
The CDMP Data Quality Specialist Exam covers several important aspects of Data quality.
In managing data, it is crucial to consider the quality of the information and how it affects business strategies. A solid business case and data quality program are necessary for successful data management. Data stewards play a significant role in defining data quality expectations and linking data lineage to business processes.
Data quality also has a direct impact on the cost of business reports. Analysing the situation using force field analysis and SWOT analysis can help determine the business impact and identify areas for improvement. It is essential to establish a common language and build a business case highlighting data quality's importance.
Understanding data quality dimensions is also crucial, as different perspectives exist. It is necessary to comprehend the importance of data quality for specific purposes and manage it accordingly. Data profiling and quality operations are also essential to ensure that the information is accurate and reliable.
Lastly, taking a data quality quiz can help prepare for the CDMP Exam and reinforce the importance of maintaining high-quality data.
Webinar Details
Title: HOW TO PREPARE FOR THE CDMP DATA QUALITY SPECIALIST EXAM
Date: 23 August 2023
Presenter: Howard Diesel
Meetup Group: Data Professionals
Write-up Author: Howard Diesel
Contents
Executive Summary
Webinar Details
Data Quality and Business Strategies
Importance of Business Case and Data Quality Program in Project Management
The Role of Data Stewards in Defining Data Quality Expectations and Connecting Data Lineage to Business Processes
The Importance of Data Quality for Cost Impact on Business Reports
Using Force Field Analysis and SWOT Analysis for Business Impact
High-quality data, improvement cycles, business impact, SWOT analysis, and tiles analysis
Threats and Opportunities Arising from DQ Challenges
Establishing a Common Language and Building a Business Case
Understanding Business Case and Data Quality Dimensions
Different Perspectives on Data Quality Dimensions
Importance of Dimensions in Data Quality
Understanding the Importance of Data Quality for Specific Purposes
Understanding and Managing Data Quality
Understanding the Importance of Data Profiling and Data Quality Operations
Data Quality Quiz
Engineering Information Subtype Discriminator
If you would like more information on the CDMP® specialist training and other training courses Modelware Systems offers, please click here to go to the training page.
If you would like more information on how the CDMP® exams work, please click here.
Data Quality and Business Strategies
During the presentation, Howard emphasised accurately mapping dimensions and understanding different perspectives. He also highlights the need to understand management operations and statistical approaches thoroughly. Excel was recommended for exam calculations. Data quality activities were discussed, starting with defining high-quality data and developing a business case or strategy to identify business needs, requirements, and data quality expectations. No further details were provided on tools and templates.
Figure 1 CDMP DQ (Data Quality) Exam Structure and Module breakdown
Figure 2 Data Quality Activities
Importance of Business Case and Data Quality Program in Project Management
Make a business case that outlines benefits and value to justify pursuing projects. To address data quality problems, understand the cost first. The CIO's views are crucial. Financial metrics like cash flow and return on investment are important. A business case must address critical questions about the data quality problem, organisation strengths and weaknesses, and resources and training needed.
Figure 3 DQ (Data Quality) Business Case: Strategy
Figure 4 Business Case Definition
Figure 5 Business Case Methodology
Figure 6 Business Case Overview
Figure 7 Business Case Cost/Benefit
The Role of Data Stewards in Defining Data Quality Expectations and Connecting Data Lineage to Business Processes
As a data steward, you are responsible for establishing expectations for data quality and identifying any issues that may arise in business operations. It is important to connect various elements, such as BI reports, application processes, and data lineage, to ensure accurate and reliable reporting. Tracing data lineage back to its source is crucial to this role. To support your work, it is essential to clearly understand the data lineage from the report back to the dataset and table. The success of a data quality program can be measured by its return on investment, which should exceed the cost of quality improvement. If you're interested in exploring data quality in greater depth, we recommend checking out Tom Redman's book "People and Data," which delves into the concept of "Friday afternoon measurement."
Figure 8 Critical Business Case Questions
The Importance of Data Quality for Cost Impact on Business Reports
As part of his job, Howard works with various business departments to analyse and measure important data elements from top records. These attributes, such as customer name, size, colour, and transaction amount, are displayed on the screen and are related to retail transactions.
To determine the quality of each record, the writer evaluates them and assigns a score out of 100. Business personnel also evaluate these records and are given a score of 1 for being perfect and 0 for being imperfect.
To ensure data accuracy, the writer applies the "rule of 10," where defective data can cost up to ten times more than perfect data. The writer calculates the cost impact of mistakes on reports, which can be significant if there are many imperfect records. Based on the findings, you may extrapolate the data and provide an estimated cost impact for the entire dataset.
Using Force Field Analysis and SWOT Analysis for Business Impact
During the presentation, Howard recommended using the "rule of 10" to estimate the impact of various factors on the business. He supported this approach by referring to credible papers found online. Howard also introduced force field analysis as a tool to understand the organisation's position, similar to a SWOT analysis but with a numeric allocation to quantify forces. The driving and restraining forces were discussed, including strengths, opportunities, external threats, weaknesses, and capabilities. Examples of technology failures and their impact on the business were provided. Howard explained how restraining forces push the problem down while driving forces alleviate it. He also referenced the Ishikawa diagram as a model to order and position challenges, highlighting external issues, internal threats and opportunities, and the role of data and technology. The potential benefits of using AI for quality enhancement were mentioned, and the concept of calculating benefits based on uplift from a baseline was explained.
Figure 9 DQ Initial Assessment with Cost Impact
Figure 10 Change Assessment Force-Field Analysis
High-quality data, improvement cycles, business impact, SWOT analysis, and tiles analysis
Our calculations have determined that a significant amount of money has been saved, which is a great benefit of the situation. The Juran Trilogy emphasises the importance of using high-quality data and continuously improving processes to achieve desired outcomes. To address our chronic waste of 33, we plan to improve using the burrito principle and select the next target. In the business case, we prioritise the impact of data quality over data science. The fishbone diagram shows how incorrect technology can negatively affect agility. Through tiles analysis, we can determine how to use our strengths to take advantage of opportunities, such as expanding internationally or launching new products. Our strengths, brand, and reputation can also assist us in addressing threats, such as poor online reviews and revenue decline. To determine potential risks, we evaluate our weaknesses and threats.
Figure 11 Example: Business Impact of Data Science
Figure 12 Issues Caused by Lack of Leadership. Fishbone Diagram
Threats and Opportunities arising from DQ Challenges
To mitigate weaknesses and drive business growth, data architects should act as agents of transformation and utilise their strengths to seize opportunities and address potential dangers posed by emerging technologies and data quality issues.
One approach is to use Excel spreadsheets to quantify the opportunities and threats the business faces, with a plus one multiplier used to quantify opportunities, resulting in a positive value. Similarly, the threats and weaknesses can be quantified using appropriate multipliers. Overall, the force field analysis reveals a favourable position in the market with a positive score of seven.
Figure 13 SWOT Analysis and TOWS Analysis
Figure 14 Change Assessment Force-Field Analysis (FFA) for ChatGPT
Figure 15 Scoring the FFA (Template)
Establishing a Common Language and Building a Business Case
Establishing common terms and definitions is important to avoid quality issues before selecting a Common Data Environment (CDE). The six friends classification (why, who, what, when, where and how) can be used to define a business definition. For instance, a learner refers to a person or group who seeks to enhance their professional capability by engaging in learning resources. Defining what a CDE means requires time and agreement from multiple stakeholders. By analysing the people in an organisation, the transition from regular employees to data managers and, eventually, data provocateurs or champions can be determined. The growth path for data management entails moving from regular employees to data managers to data champions. The DQ superhero team includes a data entrepreneur, a data steward, and other team members. When making decisions in the business case, it is important to consider and work through various factors.
Figure 16 FFA: ChatGPT Modelware Systems
Figure 17 Establish a Common Language Approach
Figure 18 The Work Team
Understanding Business Case and Data Quality Dimensions
The topic of the business case is intricate and not specific to any data quality area. When it comes to Master Level questions, this is an area that is often emphasised. During a discussion, one participant inquired if anyone had created a business case for data quality. Henry clarifies that they utilised the 1-10 theory to represent the business case visually and focused on analysing the benefits and costs. The 110-100 theory aids in incorporating data, and tools like Information Steward can exhibit values on the dataset. This section mainly highlights the justification for improvement, cost analysis, and benefits. The DMBOK recognises that no single definition of dimensions exists, and different thought leaders have diverse perspectives. This statement alludes to Dan Myers' idea of conformed dimensions.
Figure 19 DQ and Data Team "Superhero's"
Different Perspectives on Data Quality Dimensions
When evaluating data quality, it is important to consider completeness on both a column level and about interdependent fields in a table. The act of populating tables and schemas is crucial for achieving completeness in data.
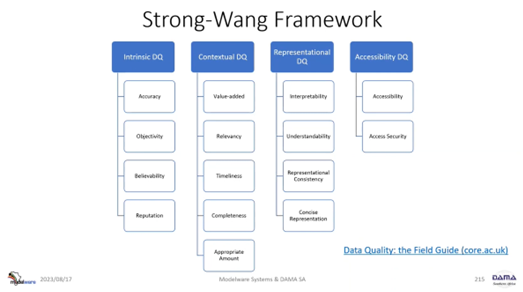
Frameworks for assessing data quality, such as Strong Wang's, categorize dimensions into intrinsic factors like data accuracy, objectivity, believability, and reputation, as well as textual, symbolic, and accessibility dimensions. Tom Redmond takes a different approach, categorising dimensions into data model, data value, and data representation. Meanwhile, Larry English discusses both inherent and pragmatic dimensions of data quality. Dami UK provides definitions for these dimensions, but it is important to note that there are multiple dimensions to consider.
When evaluating data quality, several key factors include having enough data, ensuring accuracy, consistency, and integrity, and ensuring timeliness.
Figure 20 Data Quality Dimensions: 11%
Figure 21 Strong-Wang Framework
Figure 22 Ted Redman: Data Model, Data Values and Representation
Figure 23 Larry English, Inherent and Pragmatic
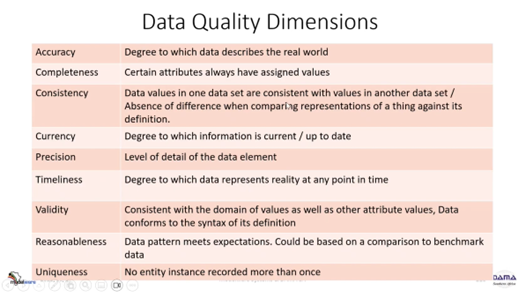
Figure 24 Data Quality Dimensions
Importance of Dimensions in Data Quality
Businesses can select the important elements for their current needs using a set of Dimensions. According to Dan Myers, data accuracy is about agreeing with the real world and the precision of data values. It is important to consider the interconnectivity among different dimensions of data quality. ISO 25 000 is a standard for products, and it includes various levels of data product quality. Ensuring data quality is fit for purpose is crucial and involves considering different perspectives and passing all necessary checks for the chosen dimensions.
Figure 25 Data Quality Dimension Focus
Figure 26 Data Quality Dimension Relationships
Figure 27 ISO 25000 Data Product DQ Dimension, Quality of Data Product
Figure 28 DQ Fit for Purpose: 12%
Understanding the Importance of Data Quality for Specific Purposes
When conducting a study, it's important to determine the specific features and population to be measured, such as in the case of measuring diabetes. This is where a cohort comes in handy, as it helps identify the specific population of patients to include in the study. By defining the purpose, the data collection requirements and measurement value set can be determined, which ensures that data quality expectations are met. The cohort serves as a system of records, similar to a master data situation, providing necessary information.
It's crucial to avoid overtraining or overengineering data in machine learning, as this can lead to biased results and poor data quality. Instead, data that's fit for purpose should follow the Goldilocks principle - neither too much nor too little. Poor data quality can have various negative impacts, such as incorrect decision-making, regulatory submission issues, revenue loss, increased costs, and reputational damage. Data quality management is critical in addressing these issues and ensuring data reliability. Working with data requires recognising its value and trustworthiness.
Figure 29 Fit for Purposes in Populations Analytics
Figure 30 Issues caused by fixing issues.
Figure 31 How Poor Data Quality Impacts Organisations & Individuals
Understanding and Managing Data Quality
It is a common misconception that data is always accurate, leading to challenges in maintaining data quality. Since no organisational business processes are perfect, data quality must be continuously aligned with these processes. It is crucial to convince the CIO that data quality is an ongoing program, not a one-time project. To effectively manage data quality, updating the culture and adopting a quality mindset is essential. A comprehensive methodology such as ISO's data quality framework can be chosen to ensure comprehensive data quality management. The impact of data architecture, integration, operations, security, and resources on data quality should be understood. To identify common causes of data quality problems, 11 causes, such as leadership gaps and system design issues, can be identified. Prevention, correction, automation, and statistical approaches can improve data quality. To understand and analyse data quality, one must familiarise oneself with data profiling tools and their purpose.
Figure 32 DQ Introduction: 10%
Figure 33 DQ Management: 11%
Figure 34 DQ Management Detailed Structure
Figure 35 ISO 8000 Parts
Figure 36 DQ Operations: 11%, Common Causes of DQ Issues
Figure 37 Data Quality Techniques
Figure 38 DQ Statistical Approaches: 11%
Figure 39 DQ Tools: 11%
Understanding the Importance of Data Profiling and Data Quality Operations
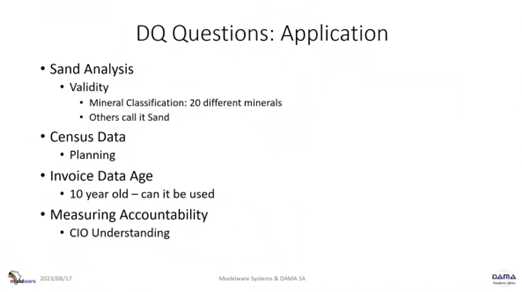
Data quality operations begin with profiling, which involves statistically assessing existing data structures to create effective data quality rules and identify problem areas. Data querying tools can be used to identify issues such as null counts and their locations in the database. Readiness is crucial for successful data quality initiatives, which involves convincing people to shift from an application-centric to a data-centric mindset and assessing the actual state of data. Both culture and technical readiness play important roles in implementation. Examples of potential exam questions may include validity analysis of sand composition, understanding census data, measuring data age and currency, field overloading issues, and measuring stakeholder accountability. Continuous improvement and goal setting are essential for data quality operations to ensure the benefits outweigh the costs.
Figure 40 Data Quality Readiness Assessment
Figure 41 DQ Questions: Application
Figure 42 DQ Specialist Exam
Data Quality Quiz
Howard helps students access the Canvas platform and shares a QR code for a data quality quiz. He confirms the quiz takes 20 minutes and assists a student with enrolment. The meeting is recorded and available for later viewing. Howard asks for questions from non-quiz takers before ending the session. The quiz was to demonstrate some of the questions that will be found in the exam. Participants found this sneak peek very helpful and insightful.
Engineering Information Subtype Discriminator
To understand the meaning of the X in the engineering information subtype discriminator, it is important to note that it represents exclusivity. The answer to this question can be found in the data modelling section of the Master data course. Subtypes can either be comprehensive or exclusive. Comprehensive subtyping involves listing every subtype, often represented in a life cycle diagram. On the other hand, exclusivity refers to whether an entity can be related to multiple subtypes simultaneously. In the diagram, the X represents exclusivity for the subtypes of person, teacher, and student. Exclusivity is also used to indicate that the person who authors a book and the person who reviews it cannot be the same. Information engineering uses the X to represent exclusivity. To understand the meaning of the X in the engineering information subtype discriminator, it is important to note that it represents exclusivity. The answer to this question can be found in the data modelling section of the Master data course. Subtypes can either be comprehensive or exclusive. Comprehensive subtyping involves listing every subtype, often represented in a life cycle diagram. On the other hand, exclusivity refers to whether an entity can be related to multiple subtypes simultaneously. In the diagram, the X represents exclusivity for the subtypes of person, teacher, and student. Exclusivity is also used to indicate that the person who authors a book and the person who reviews it cannot be the same. Information engineering uses the X to represent exclusivity.
Figure 43 Engineering Information Subtype Discriminator
If you would like more information on the specialist training and other training courses Modelware Systems offers, please click here to go to the training page.
If you would like more information on how the CDMP exams work, please click here.
If you want to receive the recording, kindly contact Debbie (social@modelwaresystems.com)
Don’t forget to join our exciting LinkedIn and Meetup data communities not to miss out!


