
Data Quality Framework & Methodologies – Data Professionals

Executive Summary
Defining critical data elements is essential for achieving quality levels. Master data systems should only include necessary details. Currency and minimum/maximum values must be monitored. Data quality rules should be defined to assess data. Root cause analysis is vital for identifying system or process issues. Waterfall is recommended for initial development, with the option to transition to agile for monitoring. Association entities help simplify data modelling.
Webinar Details
Title: DATA QUALITY FRAMEWORKS & METHODOLOGIES DATA PROFESSIONALS
Date: 21st July 2023
Presenter: Howard Diesel
Meetup Group: Data Professionals
Write-up Author: Howard Diesel
Contents
Executive Summary
Webinar Details
The Relevance of Shoe Size in a Master Data System
Challenges of Maintaining Accurate Shoe Size in Master Data System
Understanding the Importance of Critical Data Elements in Data Quality.
Approaches to Defining Data Elements and Dimensions
Data Quality Expectations and Minimum/Maximum Values
Notes on Reasonableness and Data Quality
Importance of Setting Data Quality Expectations and the Role of a Data Architect
Ensuring Data Quality in the Application.
Data Movement and Analysis.
Importance of Understanding Root Causes and Implementing Improvement Plans.
Notes on Data Quality Tool Architecture.
Organising and documenting data for analysis and data quality.
Development Approach for Data Quality.
The Importance of Effective Planning and Minimal Changes in Improvement Cycles.
Importance of Data Quality in Agile Development
Clearing up confusion on entity associations.
The Relevance of Shoe Size in a Master Data System
During the discussion, Howard Diesel used the example of “shoe size” in a master data system. “Shoe size” denoting to reference data. Drew, a member of the Webinar, proposed that “shoe size” should be treated as reference data instead of customer data. Howard clarified that although “shoe size” falls under a domain, it may not be necessary to include it in a customer master data system. Drew explained that customer data usually consists of demographics such as name, address, and age, while "shoe size" may vary in different lines of business. Howard also shared an anecdote about a shoe salesman who faced difficulties determining customer demand and conducting surveys, highlighting the challenges in making buying decisions.

Figure 1 Critical Data Elements (CDE) Criteria, Sourced from Data Governance for Certification
Challenges of Maintaining Accurate Shoe Size in Master Data System
Continuing with the “shoe size” analogy in a Master Data System. When it comes to selling all products, limited availability of “shoe sizes” can be a challenge. The accuracy of reference data can also be affected by currency fluctuations and rate changes. Due to volatility in the “shoe size” attribute, it was removed from the master data system. A forecasting algorithm was used to calculate “shoe size” instead of relying on real-time updates. It is crucial to monitor attribute changes to ensure data quality. Older individuals can expect longer intervals between “shoe size” changes. Understanding critical data elements (CDEs) is essential for assessing data quality, and the SIPOC procedure (sources of information, calculation process, output, and recipients) can help. Data plays a key role in business decision-making, so having a decision inventory is important for understanding the components of the decision process.
Understanding the Importance of Critical Data Elements in Data Quality
When doing SIPOC, it's crucial to understand data quality clearly. To guide the selection process and avoid including unnecessary information, a critical data element (CDE) is essential. The prioritisation of the most important CDE should be determined based on business use cases derived from the data strategy.
Initially, it's likely that the CDEs that people complain about the most are the most critical. To prioritise them, evaluating their business value and organisational relevance is important. The MOSCOW approach (Must, Should, Could, Won't) can be applied to determine the importance of each CDE.

Figure 2 Choosing Critical Data Elements (CDE) and Definition Flowchart
Approaches to Defining Data Elements and Dimensions
When using Power BI, having a row or dataset allows you to work with multiple values within a dimension. To define a data element, specify a minimum and maximum value and provide a rule description that helps identify any attribute failures, such as a contract number.
To start with a use case, it's crucial to identify the critical data elements first, followed by the consumers of the data and the appropriate dataset. If you're building a data product, you should start by identifying the data set and then determining the critical data elements for each consumer.
To provide context to the critical data elements, you'll need to list dimensions like the status of the measure and the rule status and message.

Figure 3 Data Quality (DQ) Expectation Template
Data Quality Expectations and Minimum/Maximum Values
When defining critical data elements, it is essential to establish a set of data quality rules and evaluate the data. Additionally, it is crucial to determine the best system of record for these critical data elements and identify the authoritative system for creating, updating, and reading the data. To ensure accuracy, it is essential to consider business processes and focus on data attributes used across multiple processes.
Having a minimum value is essential in data analysis to prioritise relevant information. Without a minimum value, confusion and wasted efforts may occur. In sales planning cycles, both minimum and maximum values are significant. It is important to note that the maximum value may not always be 100% as it varies in different scenarios. The SPC diagram can be used to identify exceptional cases above the maximum and below the minimum. It is crucial to pay attention to exceptional cases and strive for completeness, even if 100% is not attainable.
Notes on Reasonableness and Data Quality
When analysing gender population, it's recommended to begin at 60%, gradually increase to 70%, and then 80% over time. It's important to use reasonableness to detect any excessive growth, such as a 300% increase. Reasonableness should be set between 15% and 20% to identify outliers. While most dimensions can function with minimum values, some require maximum values to limit ratings. Having logical, consistent attribute values is desirable, but reasonableness can also restrict increases, such as a 15% cap on balance sheet line items.
Historical analysis can help determine reasonable growth. If there are any reasonableness errors, it's important to investigate the issue, but it doesn't necessarily mean there are inaccuracies in the data. Data quality professionals play a crucial role in ensuring accurate and reasonable data.
Importance of Setting Data Quality Expectations and the Role of a Data Architect
Before implementing a data quality framework, it's crucial to set expectations and listen to the concerns of business professionals. The framework should prioritize automation, ongoing monitoring, and daily maintenance to ensure data accuracy. Data professionals, especially the data architect, are responsible for managing data throughout its lifecycle and play a crucial role in the framework's architecture. This includes addressing application challenges, developing data products, and reporting analytics via ETL processes. To ensure data quality, it's essential to conduct SLA checks and root cause analysis. The data architect can create a comprehensive diagram and lineage to identify and resolve any issues, giving a holistic understanding of the system. Typically, root cause issues are found at the application level, focusing on system and entity relationship design.

Figure 4 Data Quality Cycle
Ensuring Data Quality in the Application
To ensure the accuracy and reliability of data, several key factors must be considered throughout the data management process. Firstly, it is vital to assess the level of protection provided by the data model to prevent the creation of incorrect data. Additionally, duplicate records should be avoided during the data entry process to maintain entry quality. Data validity should also be verified during ingestion to ensure accuracy during the transfer from applications to the warehouse. Any reporting errors should be analysed to identify the root causes of poor data quality, including consistency, timeliness, or latency issues. Challenges related to data movement from applications to the warehouse or data market should be identified and addressed. The time taken for data to move from point of entry to reporting, known as latency, should also be measured and monitored. Any potential root causes of specific data quality challenges should be analysed and addressed accordingly. Finally, clear quality requirements should be established to avoid the flow of insufficient data through the system.

Figure 5 Common Root Causes of Poor Data Quality
Data Movement and Analysis
Understanding the importance of data movement is crucial in identifying problem areas. Utilising dimensions can help comprehend potential issues related to these areas. The Ishikawa diagram is a valuable tool in identifying areas to investigate, such as people training, executives, and materials. It's important to consider data quality damage at various stages, including accuracy, and to conduct root cause analysis to determine the source of issues, such as poor system design or inadequate enterprise database design. Concerning real-world applications and agreed sources, accuracy is a key concept. Reference data is vital in ensuring accuracy by mapping and verifying information. Lastly, data analysis is a valuable tool for obtaining relevant and accurate information.

Figure 6 Importance of Data Quality Policies, Procedures and Standards
Importance of Understanding Root Causes and Implementing Improvement Plans
To improve the quality of the application, it's essential to analyse various areas, including application design, database design, and data integration. One helpful tool for identifying the root causes of issues is the Ishikawa diagram, which can be customised to include process, application, database, and policy categories. Once the root causes have been identified, they should be categorised, and an improvement plan should be created to address specific issues such as usability, accessibility, completeness, or timeliness. By tackling these different areas, it's possible to solve problems and prioritise efforts for improvement effectively.
Notes on Data Quality Tool Architecture
When integrating various systems, it's crucial to maintain high-quality data. This applies to all aspects of the enterprise, from operational records to master data and applications.
Auditing and reconciliation demand data quality, and it's vital to consider this when choosing a data quality tool. The ideal tool should offer a metadata repository for data quality rules and trend analysis results. It should also provide execution services for validating data, automating cleaning, and performing audits. Additionally, it should support data stewardship services to identify and fix data issues.
Data quality has three dimensions: machine programs can detect and fix, machines can detect, and people can fix, and people can detect and fix. Analytics and different databases are necessary to maintain metadata, assessment results, and reporting. Probes are necessary to analyse databases like JSON, Oracle, and SQL.
Data profiling, data quality assessment, understanding data models and processes, and monitoring and reporting are all core components of the data quality tool architecture.
Organising and documenting data for analysis and data quality
Understanding the processes and data flows in the database, including the tables, views, and attributes involved, is made easier with the knowledge repository. The data dictionary helps define the data dimensions and metrics across different databases and organisational units. To track data sharing and application processes, data lineage and external sources are documented in the data flow. A well-documented framework, including data models, application design, and business processes, is necessary for proper analysis and state reconstruction. The star schema design for data quality includes data groups, metrics, measures, data quality dimensions, processes, and organisational units. An essential aspect of data architecture is building a team, which requires establishing a "way of work".
Development Approach for Data Quality
Howard is contemplating the best approach to address data quality issues and is considering the differences between Waterfall and Agile development methods.
During the discussion, the speaker mentions that Waterfall may be more effective for establishing a reliable foundation for data quality as it prioritises accuracy from the outset.
Although Agile allows for flexibility in changing requirements, it may not be optimal when confronted with numerous data quality problems.
Howard suggests that a Waterfall strategy should be implemented for the initial iteration to create boundaries and metrics. Then a more Agile approach can be utilised for ongoing monitoring.
The importance of identifying the root cause of data quality issues and resolving them before progressing towards achieving the desired level of quality is emphasised.
One of the participants, Ben, agrees that a Waterfall approach should be adopted initially, followed by a more Agile approach for subsequent iterations.
Another participant, Raj, supports using Waterfall to lay the groundwork as it cannot be completed in a short period.
Howard stresses that starting with a Waterfall approach is crucial for success, particularly when building a strong foundation for data quality.
A switch to an Agile approach can be considered once the initial objectives have been achieved and the end goal has been reached.
Howard favours staying with the Waterfall approach and emphasizes the importance of establishing a strong foundation for data quality.
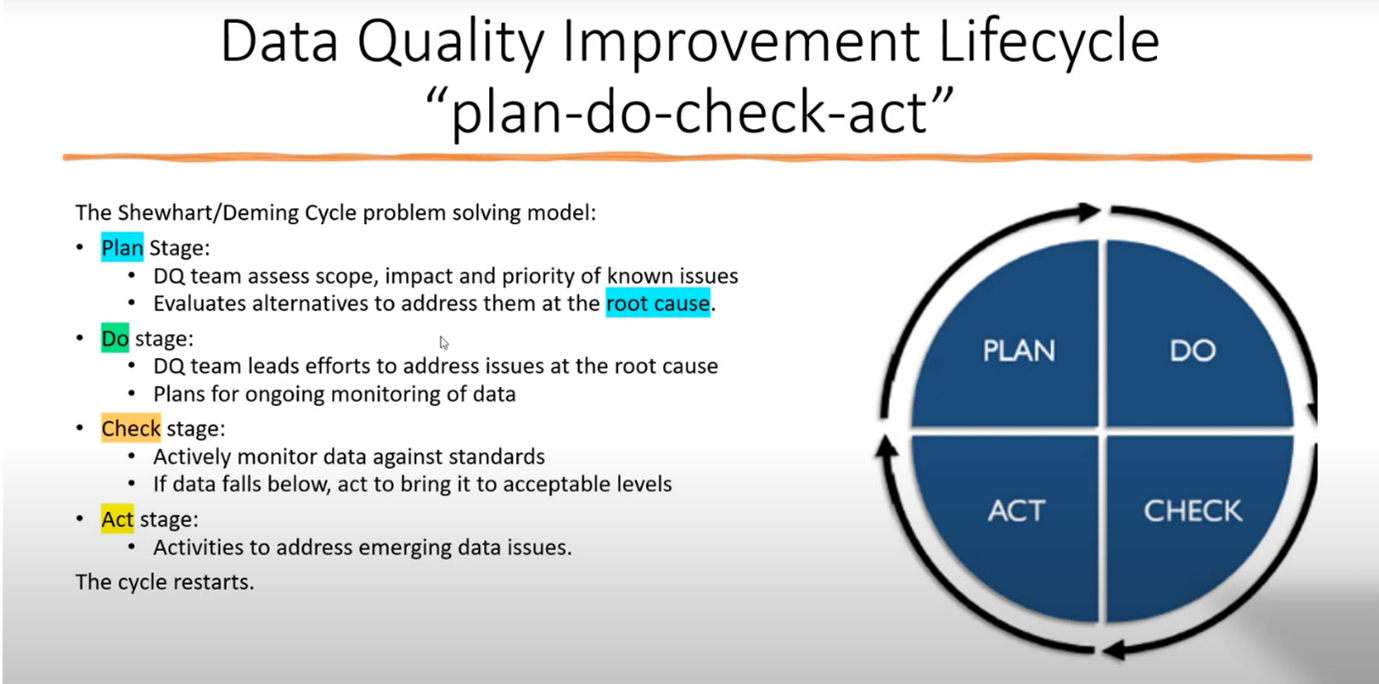
Figure 7 Data Quality Improvement Lifecycle "Plan-Do-Check-Act"
The Importance of Effective Planning and Minimal Changes in Improvement Cycles
It is crucial to fully understand and address the underlying causes of problems in the improvement cycle. To avoid unexpected issues, changes should be kept to a minimum during the planning, fixing, and checking stages.
While Agile methodology can encourage innovation and allow for changes, limiting the number of changes made during improvement cycles is best. Howard emphasises the importance of using the Pareto principle to identify and prioritise the main issues contributing to 80% of the problems.
During improvement cycles, an architect is responsible for defining the work process and ensuring it is appropriately executed. Howard acknowledges the suggestion of using agile methodology for future improvements but also stresses the significance of a Waterfall approach to achieving the next target level effectively and maintaining planned fixes.
Importance of Data Quality in Agile Development
When aiming to boost product quality from 60% to 70%, assessing and understanding the situation correctly is crucial. Addressing one issue may cause others, leading to setbacks if not handled correctly. Prioritising which issues to tackle during each sprint or iteration is essential. Some methodologies, like Agile, may not be suitable for certain aspects, such as data quality and distributed ledger projects. The DMBOK discusses data modelling notation for representing associations, while the Maurice notation represents associative entities. Peter Chen’s ‘Chen notation’ uses a diamond to link attributes. Veronica inquires about the Chen notation, a specific data modelling notation.
Clearing up confusion on entity associations
Chen’s notation utilises a diamond shape to depict entity attributes, spreading them out instead of packing them within the entity box. The website gleek.io illustrates that entity one comprises entity two. When an association has its attributes, it transforms into an Associated entity. In instances where there are too many, dividing associations with an Associated entity is crucial.
If you want to receive the recording, kindly contact Debbie (social@modelwaresystems.com)
Don’t forget to join our exciting LinkedIn and Meetup data communities not to miss out!
Please don’t forget to Join us every Thursday for more exciting and interesting webinars!